


 United States (USD)
 Singapore (SGD)
 African Country (USD)
 Australia (AUD)
 Canada (USD)
 Egypt (USD)
 European Country (EUR)
 Hong Kong (HKD)
 India (USD)
 Indonesia (IDR)
 Iran (USD)
 Iraq (USD)
 Japan (JPY)
 Myanmar (USD)
 Oman (USD)
 Philippines (USD)
 Qatar (USD)
 Saudi Arabia (USD)
 Switzerland (CHF)
 Taiwan (USD)
 Turkey (USD)
 UAE (USD)
 United Kingdom (GBP)
 International (USD)
Rated 4.98-stars across 4.8K+ reviews



 By
By
GWAS is how scientists scan the genomes of hundreds of thousands of people to find genetic spots linked to disease or traits. This article explains the method, Manhattan plots, and the key limitations to keep in mind.
Hello, everyone. As a doctor who works with genetic data every day, I'd like to introduce you to a tool that sits behind all those headlines you often see — "scientists find gene linked to disease X." That tool is called GWAS. It is a cornerstone of modern genetics and the source of the genetic risk scores we use today. At the same time, it is a tool that is very easily misunderstood, so I want to explain both its strengths and its limitations as honestly as I can.
Imagine we have two groups of people. The first group has type 2 diabetes; the second does not (we call them controls). We then read everyone's DNA at the same millions of positions across the whole genome and ask a simple question: "Are there any positions where one genetic pattern shows up in the disease group significantly more often than in the control group?" That, in a nutshell, is what a GWAS does.
The positions we compare are called SNPs (Single Nucleotide Polymorphisms) — spots where a person's genetic code can differ by just a single letter, for example some people carry an A while others carry a G. Humans have millions of common SNPs, and a GWAS systematically scans for an association one position at a time. The rough steps are:
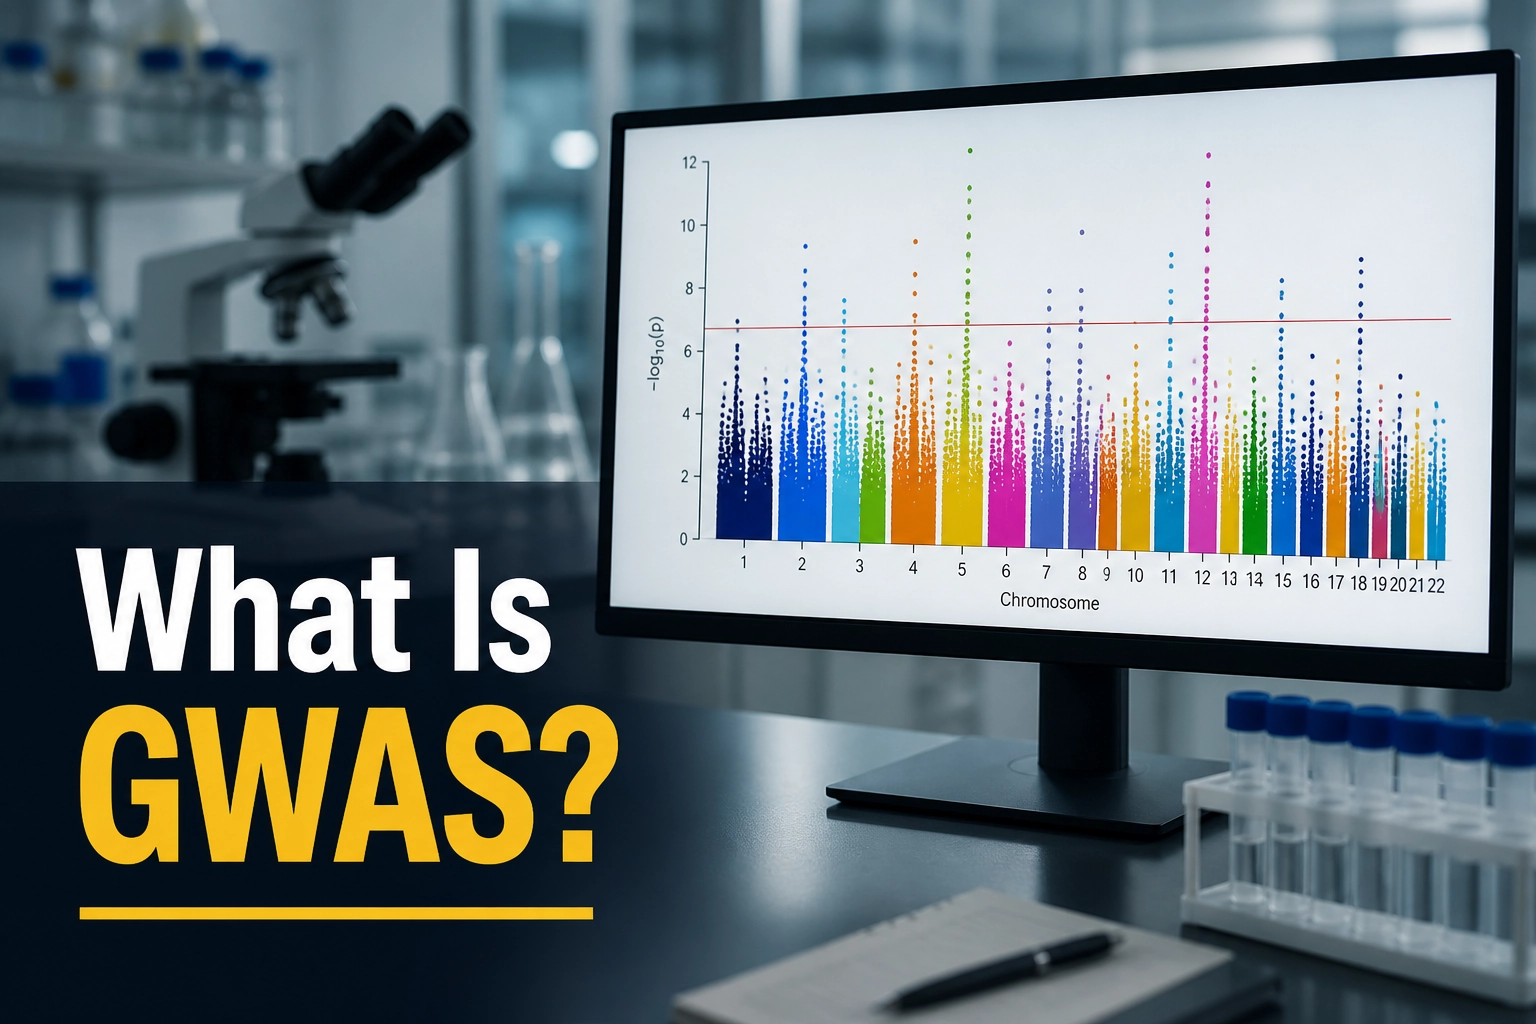
If you have ever seen a chart with dense dots strung out in a long line, with tall spikes rising up here and there like the skyline of a city full of skyscrapers, that is a Manhattan plot. The name comes from its resemblance to the Manhattan skyline. Here is how to read it:
The reason the threshold is as strict as 5×10⁻⁸ is that we test millions of SNPs at once. If we used a loose everyday cut-off like p < 0.05, we would flag tens of thousands of "false positives" purely by chance.
This is the point I always stress with my patients. When a GWAS says a SNP is "associated" with a disease, it does not mean that SNP directly "causes" the disease, for several reasons:
So carrying one risk SNP is not a "verdict" that you will develop a disease — it only shifts your probability slightly. This idea is the very foundation of polygenic risk scores, which combine the weak signals from many SNPs into a single score, and it also underpins how we assess genetic cancer risk.
The limitation I consider most important in GWAS today is the lack of diversity in the databases. Most of the world's GWAS data (estimated at more than 80% across several periods) comes from participants of European ancestry, even though this group is only a minority of the global population. This has real consequences for Asians like us, in several ways:
This is why the global genetics community is pushing for studies in more diverse populations, and it is why having databases built from Thai and Asian people ourselves is so valuable.
To be fair to the science, I want to spell out the limitations clearly so we do not over-interpret the results:
In my view, GWAS is a powerful tool that has transformed medicine. But its real value only emerges when we use it with an understanding of its limits — and do not read our genes as an unchangeable fate.
1. How is a GWAS different from an ordinary DNA test?
A GWAS is population-level research that compares the SNPs of tens to hundreds of thousands of people to discover genetic positions associated with a disease or trait. An individual DNA test, by contrast, applies the knowledge gained from GWAS to estimate one person's risk. Put simply, GWAS is the discovery, and the test is the application.
2. If I carry a risk SNP that GWAS found, does that mean I will definitely get the disease?
No. Most SNPs that GWAS find raise risk only slightly. Complex diseases arise from many genetic positions combined with lifestyle and environment. Carrying a risk SNP only shifts your probability a little, not a verdict, and many factors remain modifiable through healthy habits.
3. What can a Manhattan plot tell us?
A Manhattan plot summarises a whole-genome GWAS in a single image. The X-axis is position along the chromosomes and the Y-axis is the level of statistical significance. Spikes that rise above the threshold line (around 5x10 to the minus 8) mark positions credibly associated with the trait being studied.
4. Why does ancestry diversity matter for GWAS?
Because most GWAS data comes from people of European ancestry, the risk scores built from it often become less accurate when applied to Asian or other ancestry groups. Building databases from Thai and Asian populations ourselves helps make risk assessment more accurate and fair for everyone.

